Posts

Showing posts from December, 2018

Still Some Gap For Downside?

Image
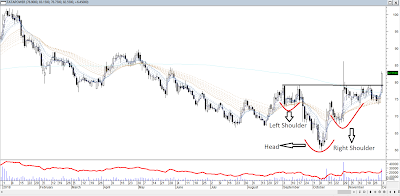
In my previous article which was publish on 01st Dec 2018 where I have mentioned that Nifty support level of 10700 Spot Level will play an important and crucial role (Here is the Link of previous article:- https://in.investing.com/analysis/fasten-your-seat-belt-as-some-flight-turbulence-ahead-in-nifty-200206407 .  Yesterday after gap down opening it has break that level of 10700 Spot Level on Daily chart and also formed a bearish price pattern called Ascending Tringle or Down Flag with volume which might drag down the Nifty to previous low of 10000-10100 but with important resistance on the upside will be 10665. Below is the chart. Nifty may witness some flight turbulence in next week as in Month because of Global and Micro Economic data will be publish such events like ,US Trade War, State Election Result and Opec Meeting.  So before taking any view  / position on index do consult with your Financial Adviser. Disclosure:- This presentation / newslette...

Roller Coaster Ride in Power Stock.

Image
Nse: Tata Power Since after a decline in a stock since January 2018 from 100.80 (Close as on 03 rd Jan 2018) was in down trend and also it has been corrected almost 35%-40% to its low of Rs 59.80 (Close as on 09 th Oct 2018) and after that it has revers the trend into Up Trend. Today it has given the breakout of Inverted Head & Shoulder which can be seen in Below Chart also with that stock has close above 200DMA and formed a Island reversal Bullish Candle with Huge Volume which also indicates there might be some upside rally yet to come. Breakout of above price pattern we might witness up rally of 15% to 20% in a short term and if there is something negative than main and important support line of Rs 78. *Disclosure :- This presentation / newsletter / report is strictly for information and illustrative purposes only and should not be considered to be an offer, or solicitation of an offer, to buy or sell any securities or to enter into any Portfolio Ma...

2 Bullish Counter.

Image
Nse Code:- Exide Nse:- Exideind After Seeing a correction in the counter which started from Month of August 2018 from 304.70 till 237. Now it has form a reversal pattern with Bullish Engulfing Candlestick Pattern with Increase in Volume as well. Already counter is making Higher top and Higher Bottom in Long term Chart. It has also break a one consolidation channel pattern since October 2018 which might take this counter to next level of Rs 300 with main Support of 250.  Below is the weekly Chart of Exide Ind. (Horizon:- 1- 2 Weeks) NSE:- Radico Khaitan After Seeing a sharp correction in the counter which started from Month of September 2018 from 494.70 it went down till Rs 297. Now the time of stock is here where it might see the rally till Rs 500 which it’s previous High. After stock surge by 5.25% up on Friday by Closing Value of 415.30 It has formed Island Reversal Candlestick Pattern with Volume and it also Closed Just above it 200DSMA as we...

Nifty Weekly Article.

Image
Today i am going to share my view on Nifty where we have witness a sharp recovery in Nifty 50 on 29th Nov 2018 which break the consolidation channel. In Daily Chart which attach below Nifty 50 has formed a Bullish Price Pattern with increased in volume called Inverted Head & Shoulder which might take nifty to 11500 but saying that it has very crucial support of 10700 Both are spot levels.    But saying that, In Weekly Chart of Nifty the Candle Stick Pattern Called Bullish Percing with Increase Volume which can be seen on below chart. It Shows that in upcoming days Nifty Might see some move till 11170 but the main crucial support which is coming at 10650 will be very important for next week. Nifty may witness some filght turbulance in next week as in Month because of Global and Micro Economic data will be publish such events like G20 Minutes, US Trade War, State Election Result, RBI Policy and Much More. So before taki...